
Check-in
Check-in attendance
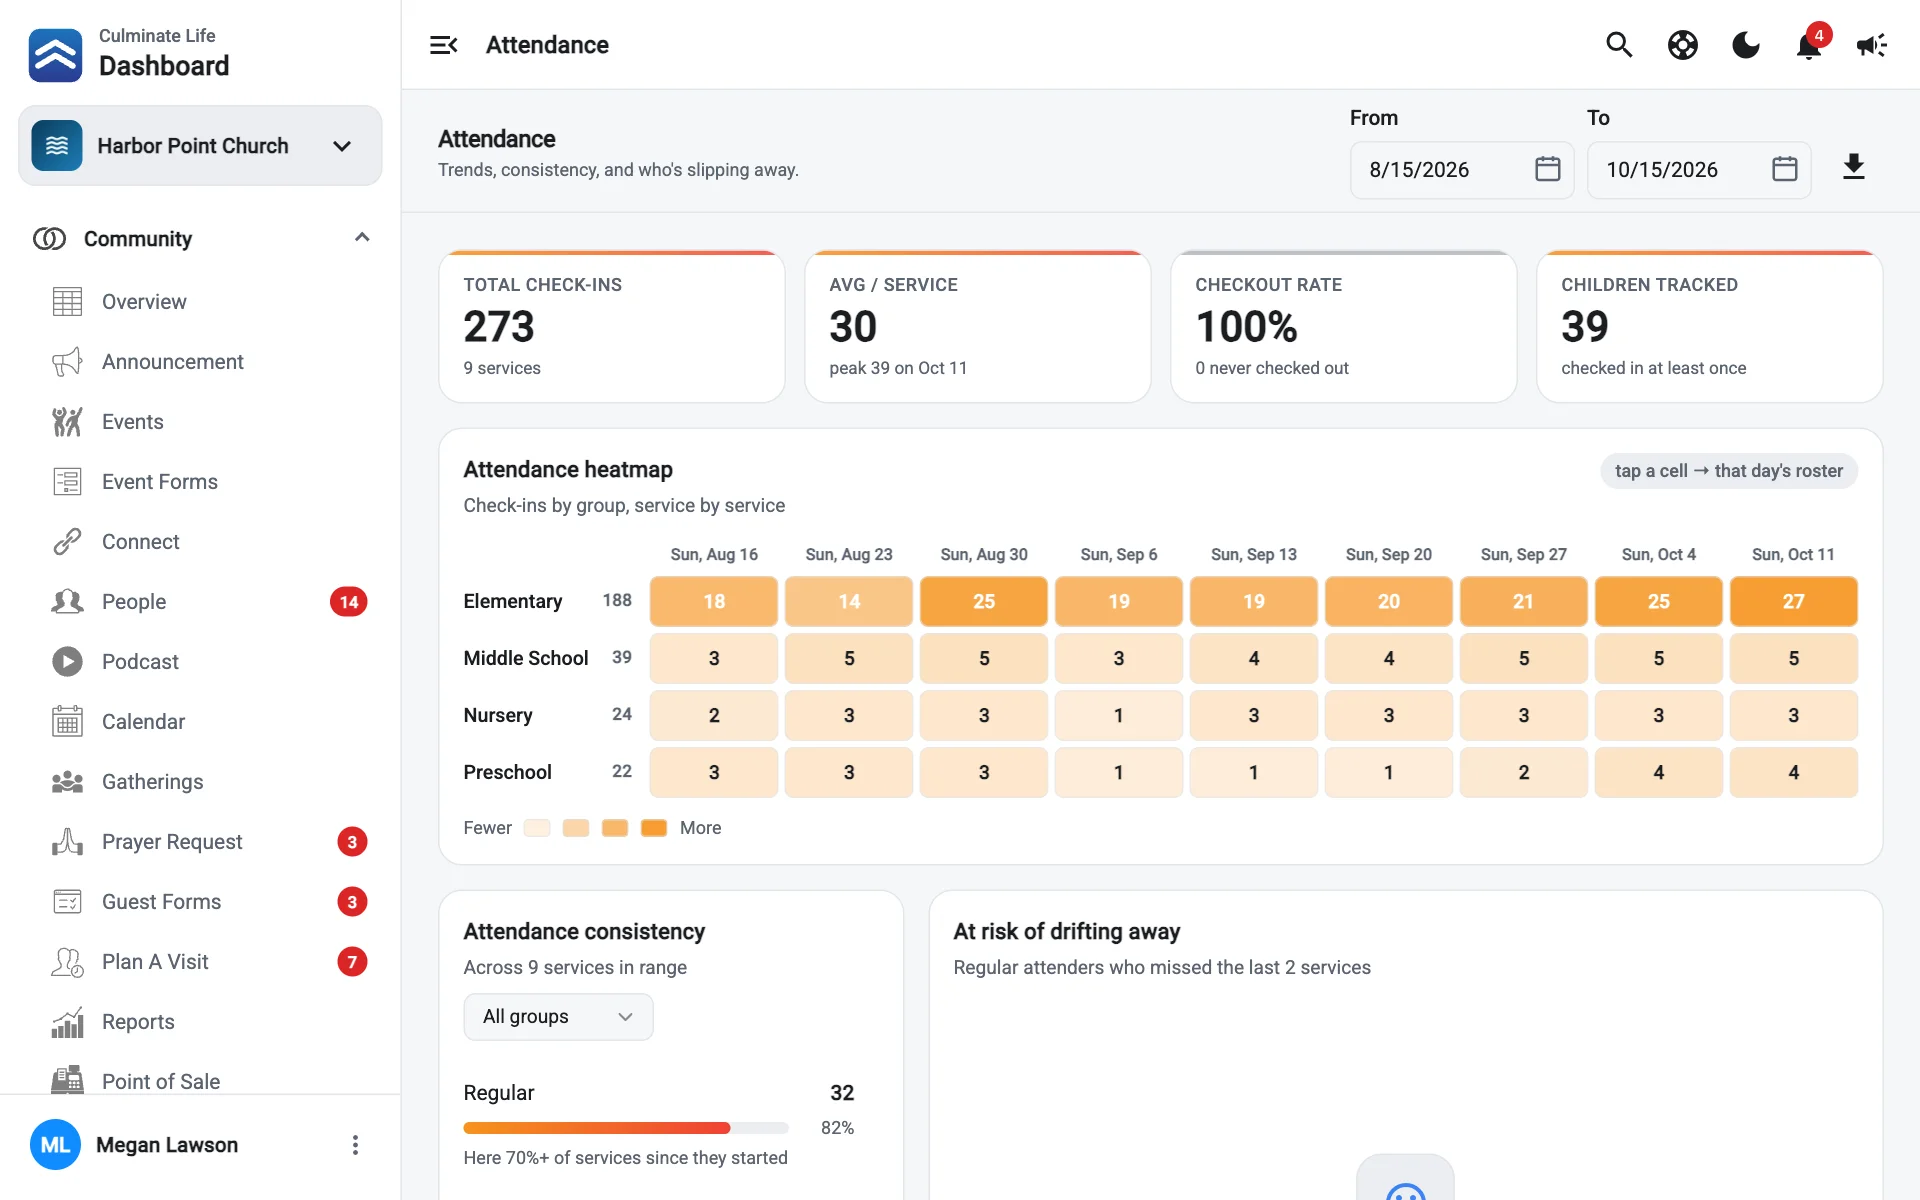
See attendance by group and service, open a day’s roster, and find kids who are drifting away.
Open Check-in → Attendance and choose a From and To date.
The numbers
| Number | What it means |
|---|---|
| Total Check-ins | Across every service in the range. |
| Avg / Service | Average check-ins per service, with the peak. |
| Checkout Rate | Share of check-ins that were checked out, and how many never were. |
| Children Tracked | Children who checked in at least once. |
Attendance heatmap
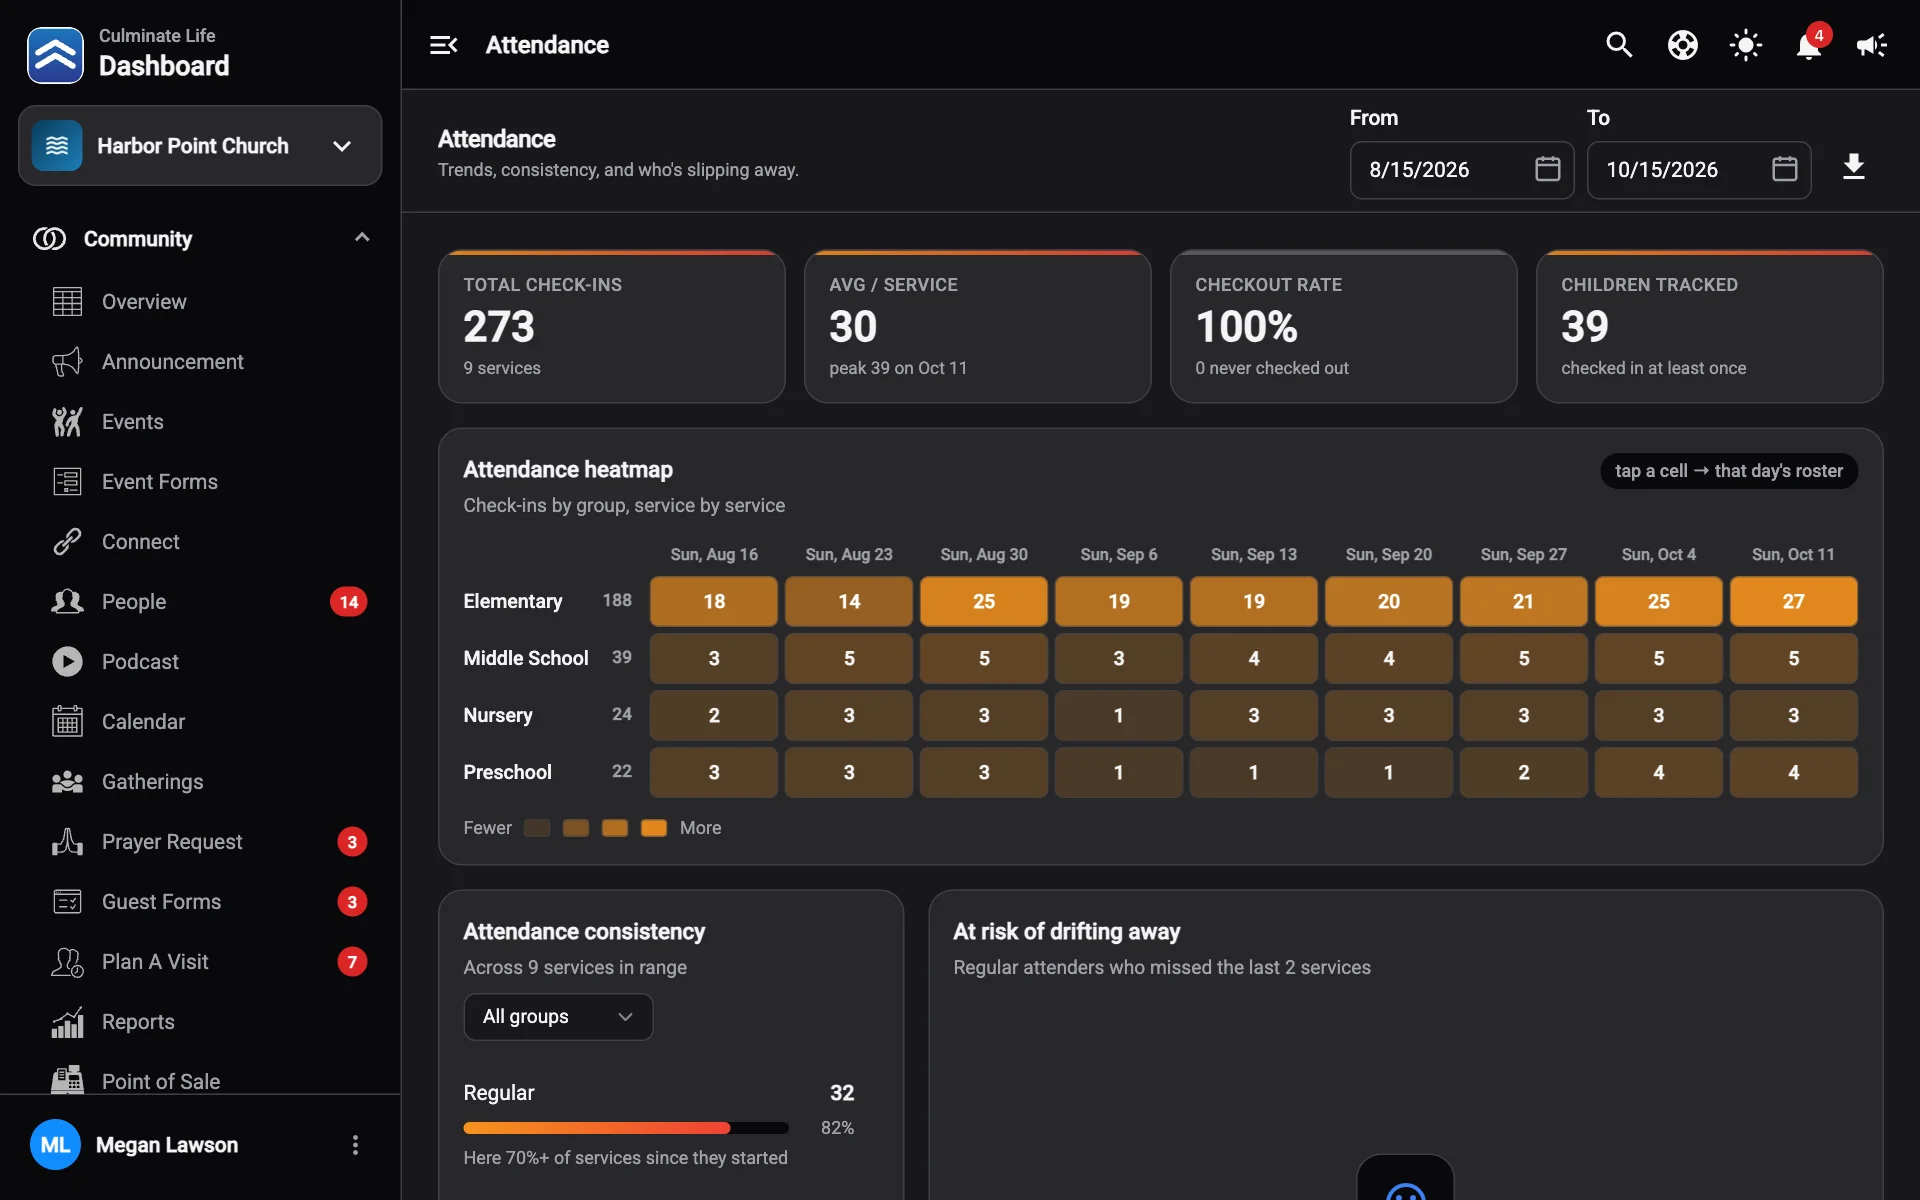
Check-ins by group, service by service. Darker squares mean more kids. Select a square to open that day’s roster.
Attendance consistency
At risk of drifting away lists regular attenders who missed the last two services, so your team can reach out. Filter by group or day of week. Select a group to see each child, how many services they came to, and when they were last seen.
A day’s roster
Select a day on the heatmap (or on the overview) to open its roster.
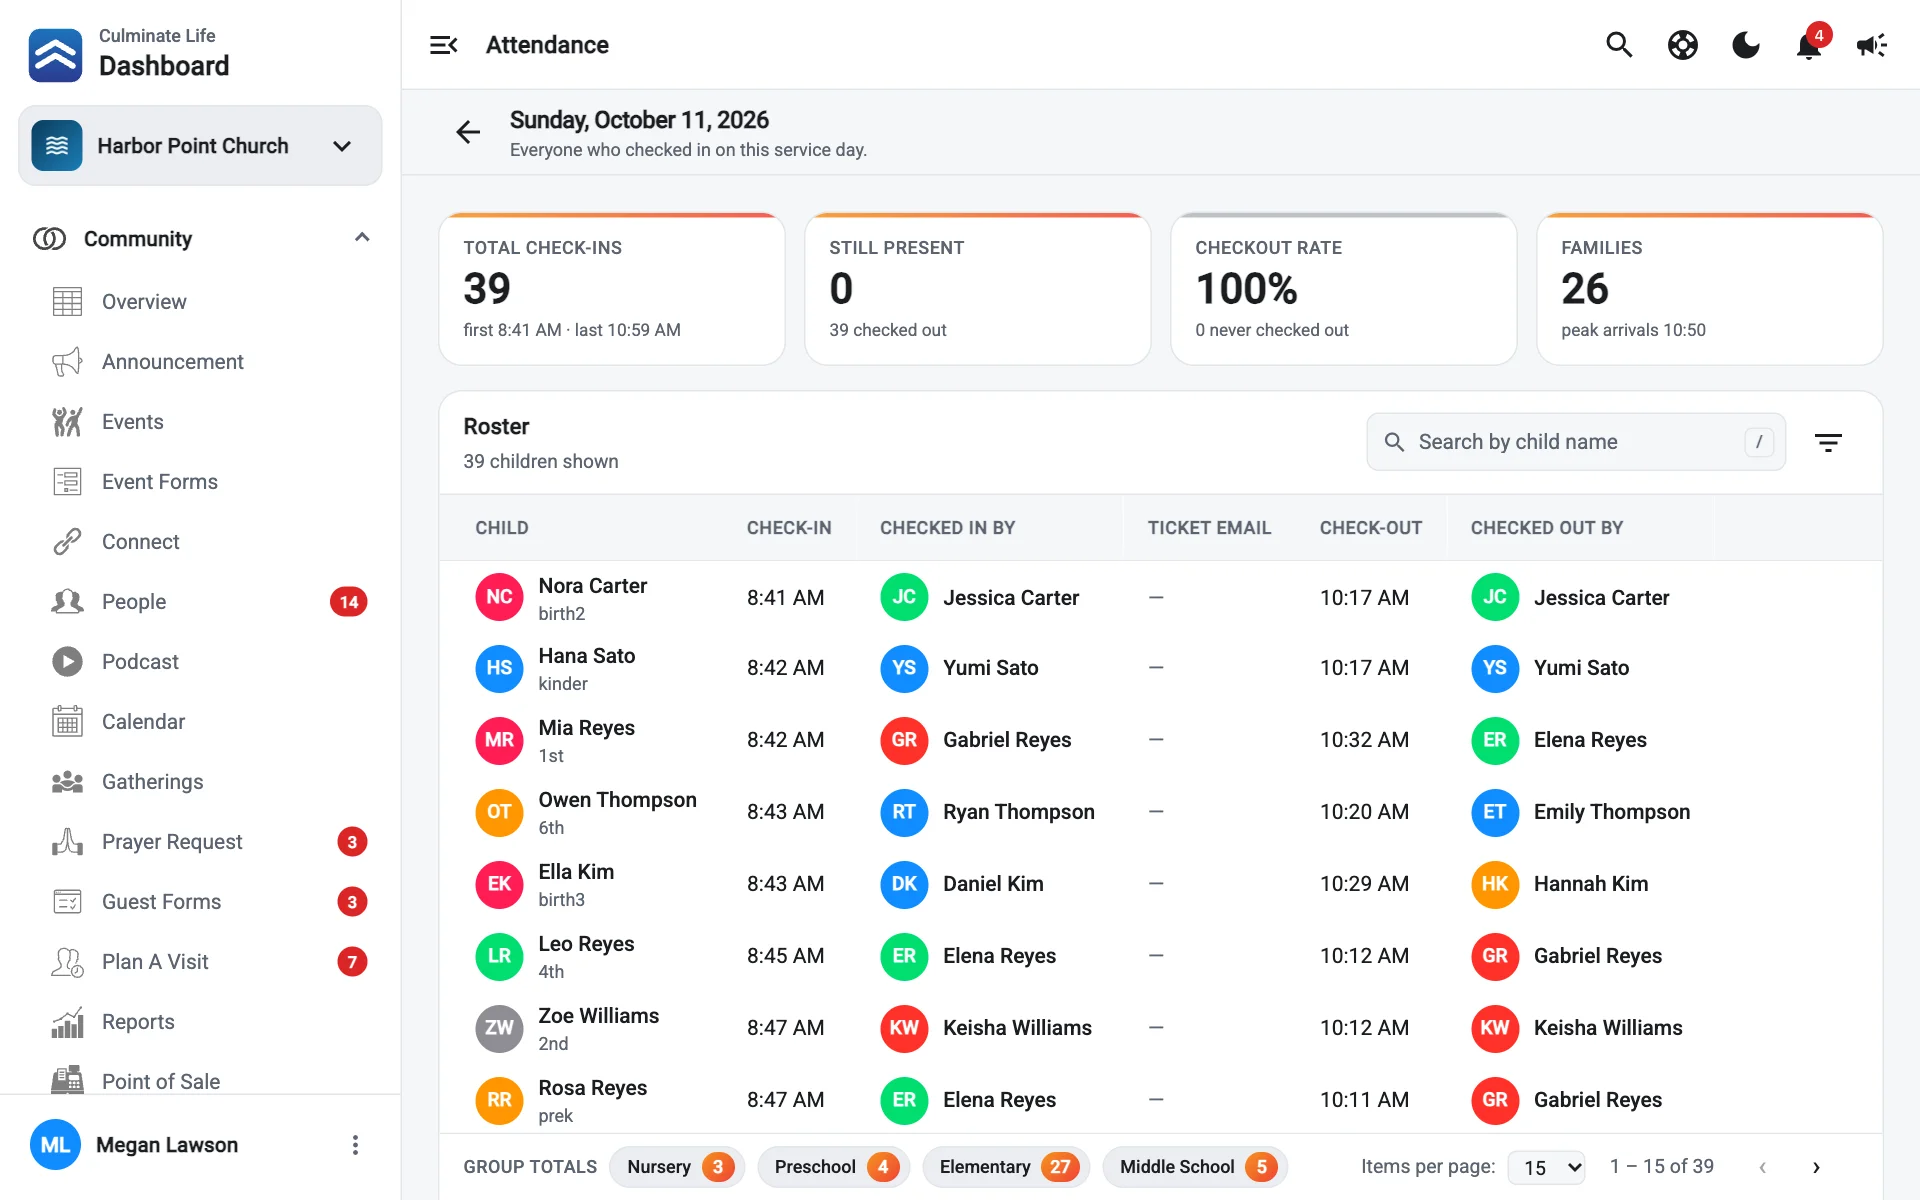
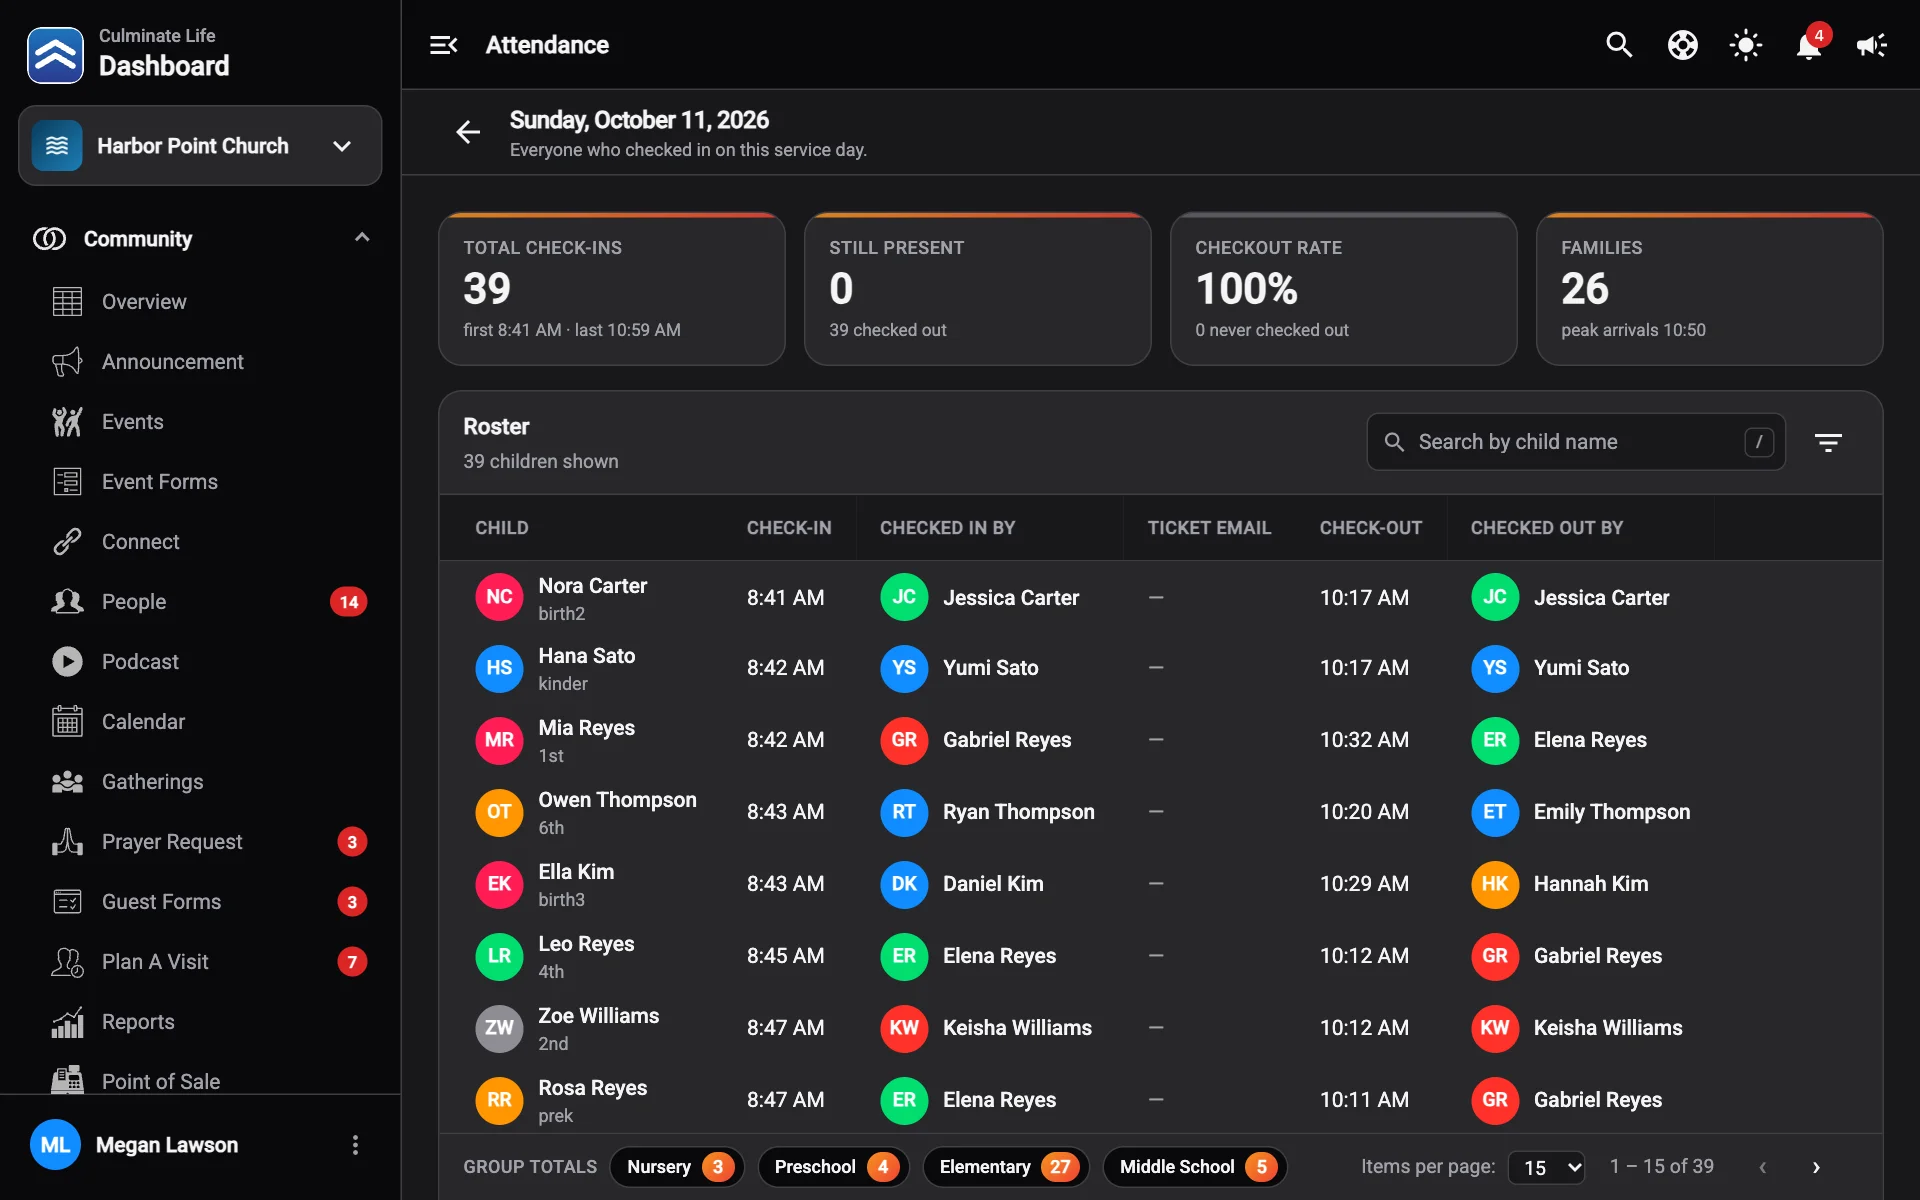
- Total Check-ins, Still Present, Checkout Rate, and Families.
- Roster: each Child, their Check-in time and who Checked in by, the Ticket email, and their Check-out time and who Checked out by. Search by child name or filter by group.
- Group totals, a Check-in timeline of when families arrived, and a breakdown By grade.
Checked out by shows the parent who used the app to check out. If someone checked out with a printed label, it shows the parent who checked the child in, because the label was printed for them.
Select Download attendance CSV to save attendance for the range.
Coming soon
Room capacity (how full each room runs against its limit) and Volunteer-to-child ratio (staffing coverage per group) are on the way.